Why Visualization? Task Abstraction for Analysis and Design
PhD Dissertation by Matthew Brehmer, InfoVis Group, University of British Columbia
Abstract
Why do people visualize data?
People visualize data either to consume or produce information relevant to a domain-specific problem or interest. Visualization design and evaluation involves a mapping between domain problems or interests and appropriate visual encoding and interaction techniques. This mapping translates a domain-specific situation into abstract visualization tasks, which allows for succinct descriptions of tasks and task sequences in terms of why data is visualized, what dependencies a task might have in terms of input and output, and how the task is supported in terms of visual encoding and interaction idioms. Describing tasks in this way facilitates the comparison and cross-pollination of visualization idioms across application domains; the mapping also applies in reverse, whenever visualization researchers aim to contextualize novel visualization techniques.
In this dissertation, we present multiple instances of visualization task abstraction, each integrating our proposed typology of abstract visualization tasks. We apply this typology as an analysis tool in an interview study of individuals who visualize dimensionally reduced data in different application domains, in a post-deployment field study evaluation of a visual analysis tool in the domain of investigative journalism, and in a visualization design study in the domain of energy management.
In the interview study, we draw upon and demonstrate the descriptive power of our typology to classify five task sequences relating to visualizing dimensionally reduced data. This classification is intended to inform the design of new tools and techniques for visualizing this form of data.
In the field study, we draw upon and demonstrate the descriptive and evaluative power of our typology to evaluate Overview, a visualization tool for investigating large text document collections. After analyzing its adoption by investigative journalists, we characterize two abstract tasks relating to document mining and present seven lessons relating to the design of visualization tools for document data.
In the design study, we demonstrate the descriptive, evaluative, and generative power of our typology and identify matches and mismatches between visualization idioms and three abstract tasks relating to time series data.
Finally, we reflect upon the impact of our task typology.
(Also see this Up-Goer Five version of the abstract using the ten hundred most used English words.)
About the Author
Dr. Matthew Brehmer (@mattbrehmer) is an alumni of the InfoVis and Multimodal User Experience groups at the University of British Columbia, advised by Tamara Munzner. Matthew holds an M.Sc in Computer Science (Specialization in Human-Computer Interaction) from the University of British Columbia (2011), and a B.Computing (Honours) in Cognitive Science from Queen's University (2009). He defended his dissertation on March 23rd, 2016.
Dissertation
Bibliography
Contents
Introduction
-
A Typology of Abstract Visualization Tasks
[a version of the IEEE TVCG / Proc. InfoVis 2013 paper]
-
Interview Study:: Visualizing Dimensionally-Reduced Data: Interviews with Analysts and a Characterization of Task Sequences
[a version of the ACM BELIV 2014 paper]
-
Field Study:: Overview: The Design, Adoption, and Analysis of a Visual Document Mining Tool For Investigative Journalists
[a version of the IEEE TVCG / Proc. InfoVis 2014 paper]
-
Design Study:: Matches, Mismatches, and Methods: Multiple-View Workflows for Energy Portfolio Analysis
[a version of the IEEE TVCG / Proc. InfoVis 2015 paper]
Reflection and Conclusion
Bibliography
Appendix A: Task Typology (A Chronology)
Appendix B: Interview Study Supplemental Materials
Appendix D: Field Study Supplemental Materials
Appendix D: Design Study Supplemental Materials
Appendix E: Consent Forms
Index
Defence Talk
- Slides (12 MB PDF).
Chronology
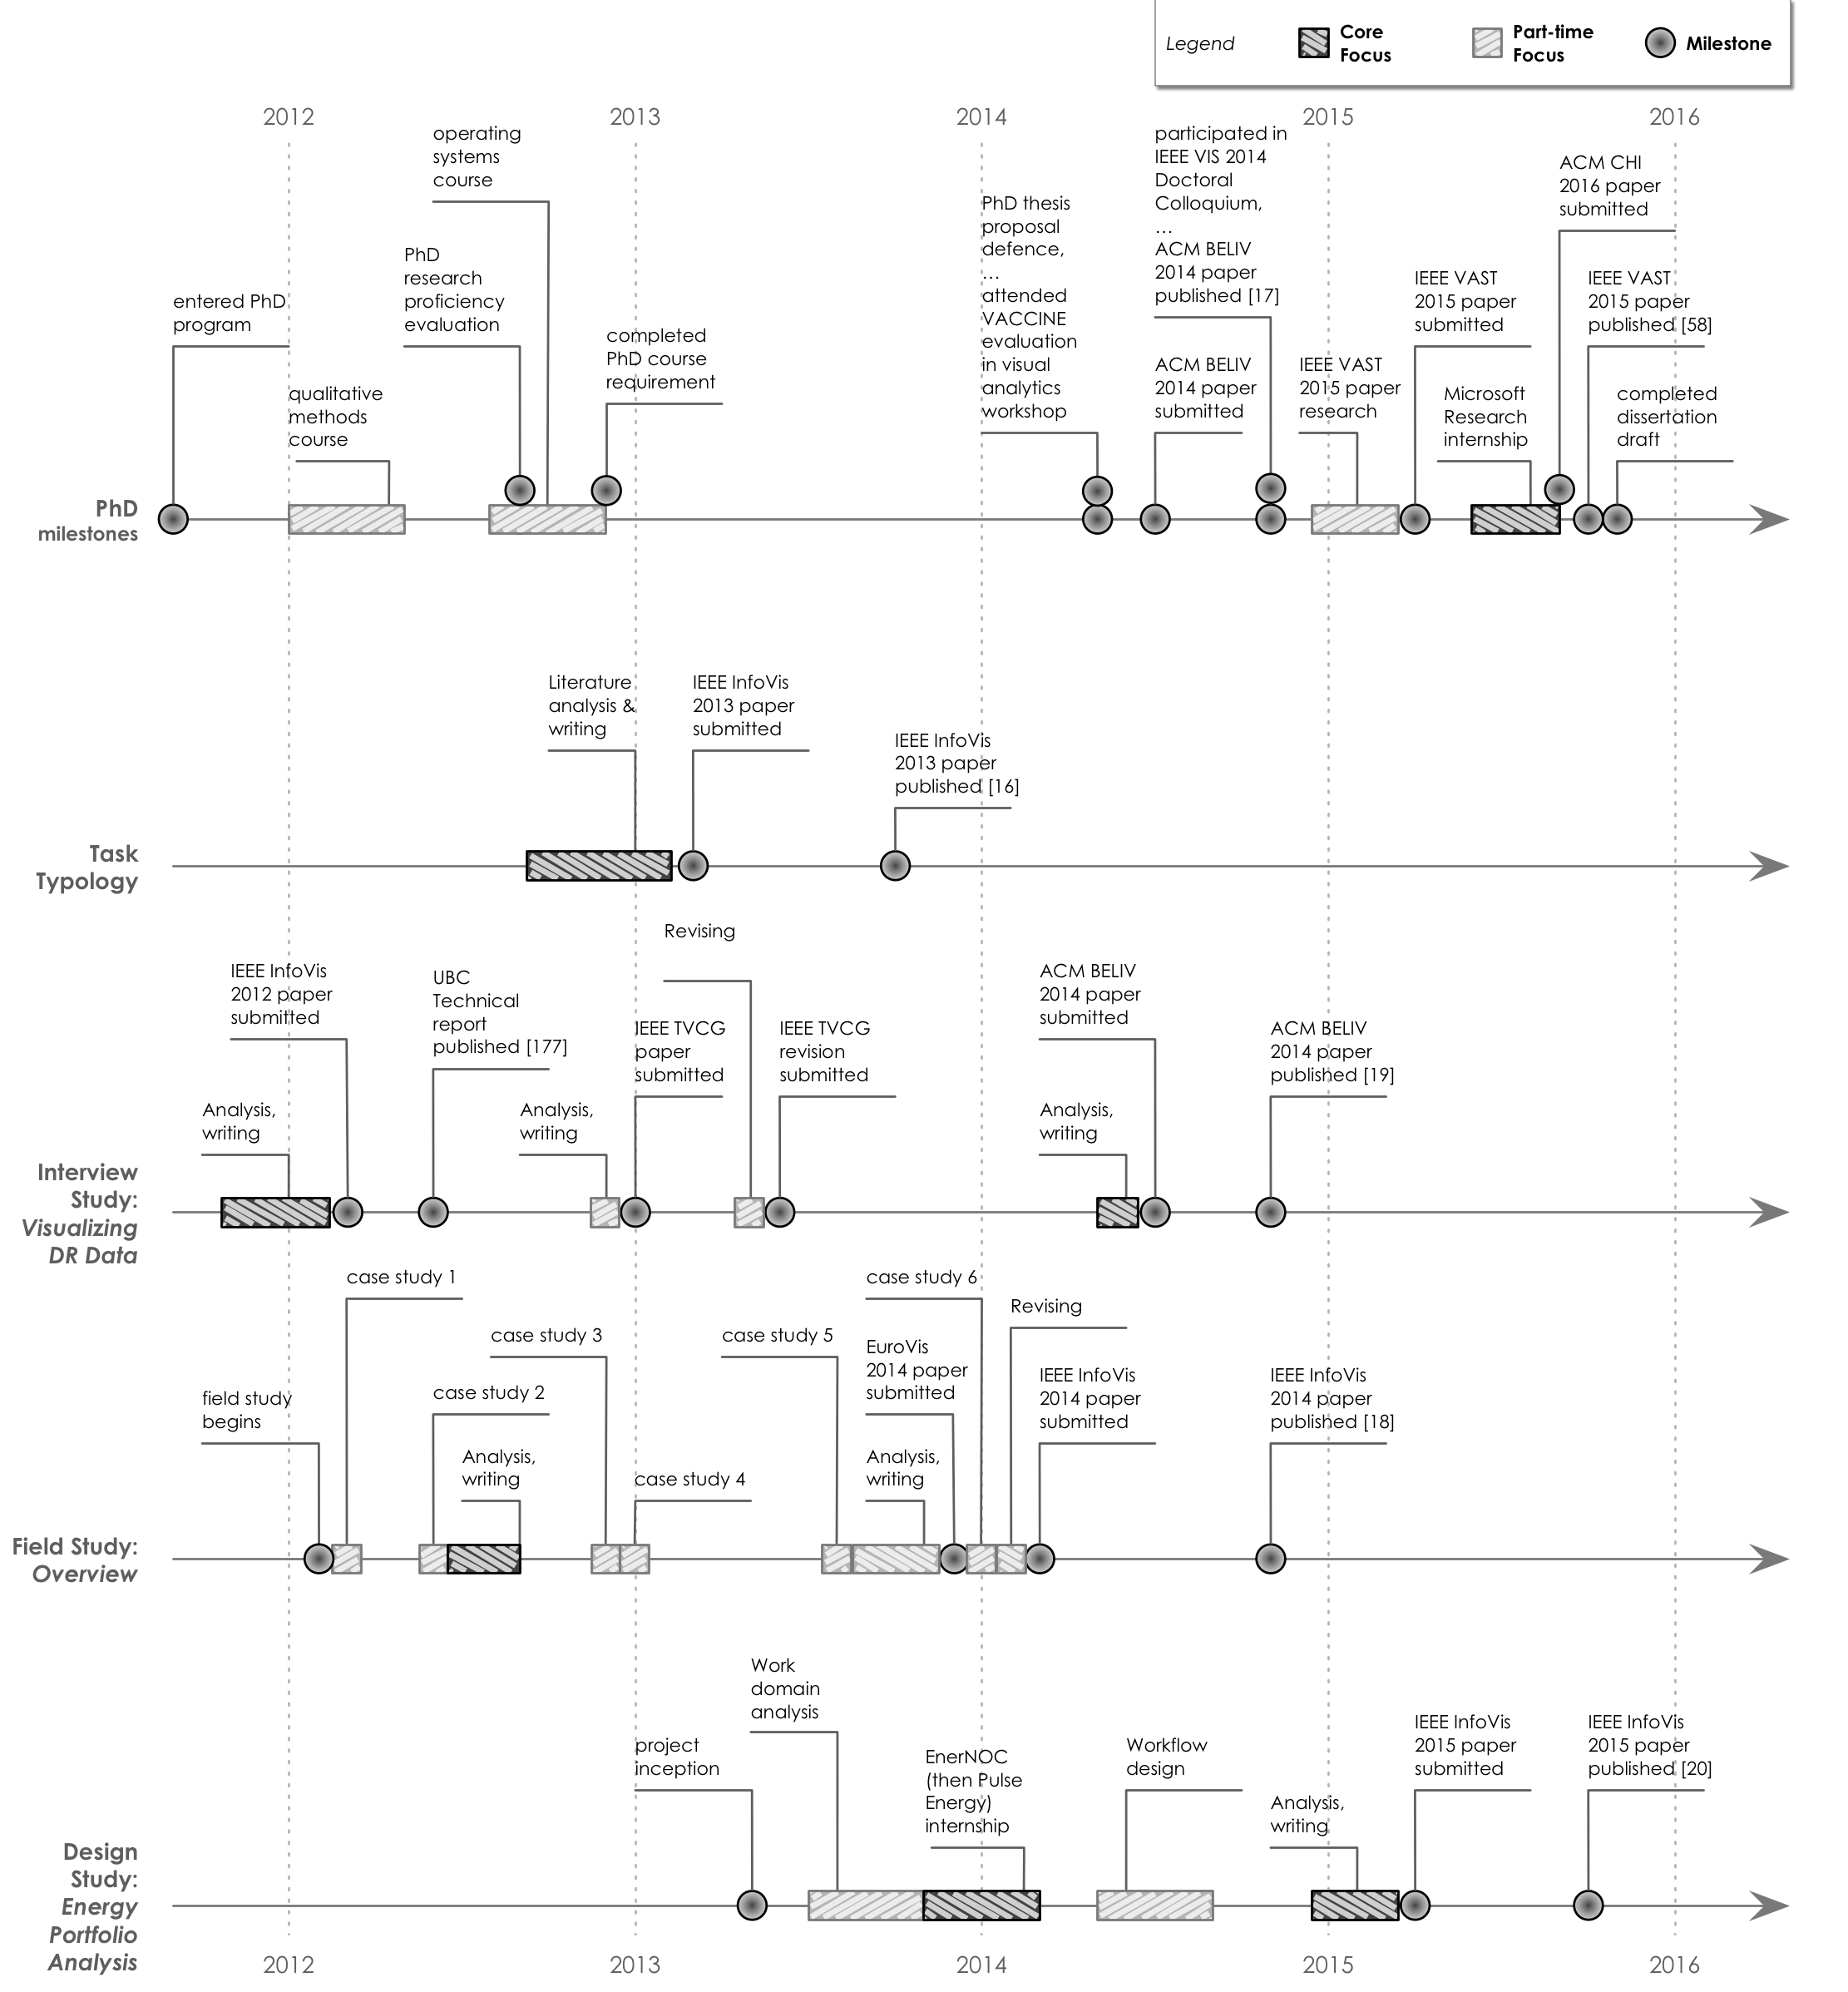
This diagram depicts the chronology of the projects described in this dissertation. Click to view a larger version of the diagram in a new tab.
Figures
License
Contact
mattbrehmer[at]gmail[dot]com | @mattbrehmer.
